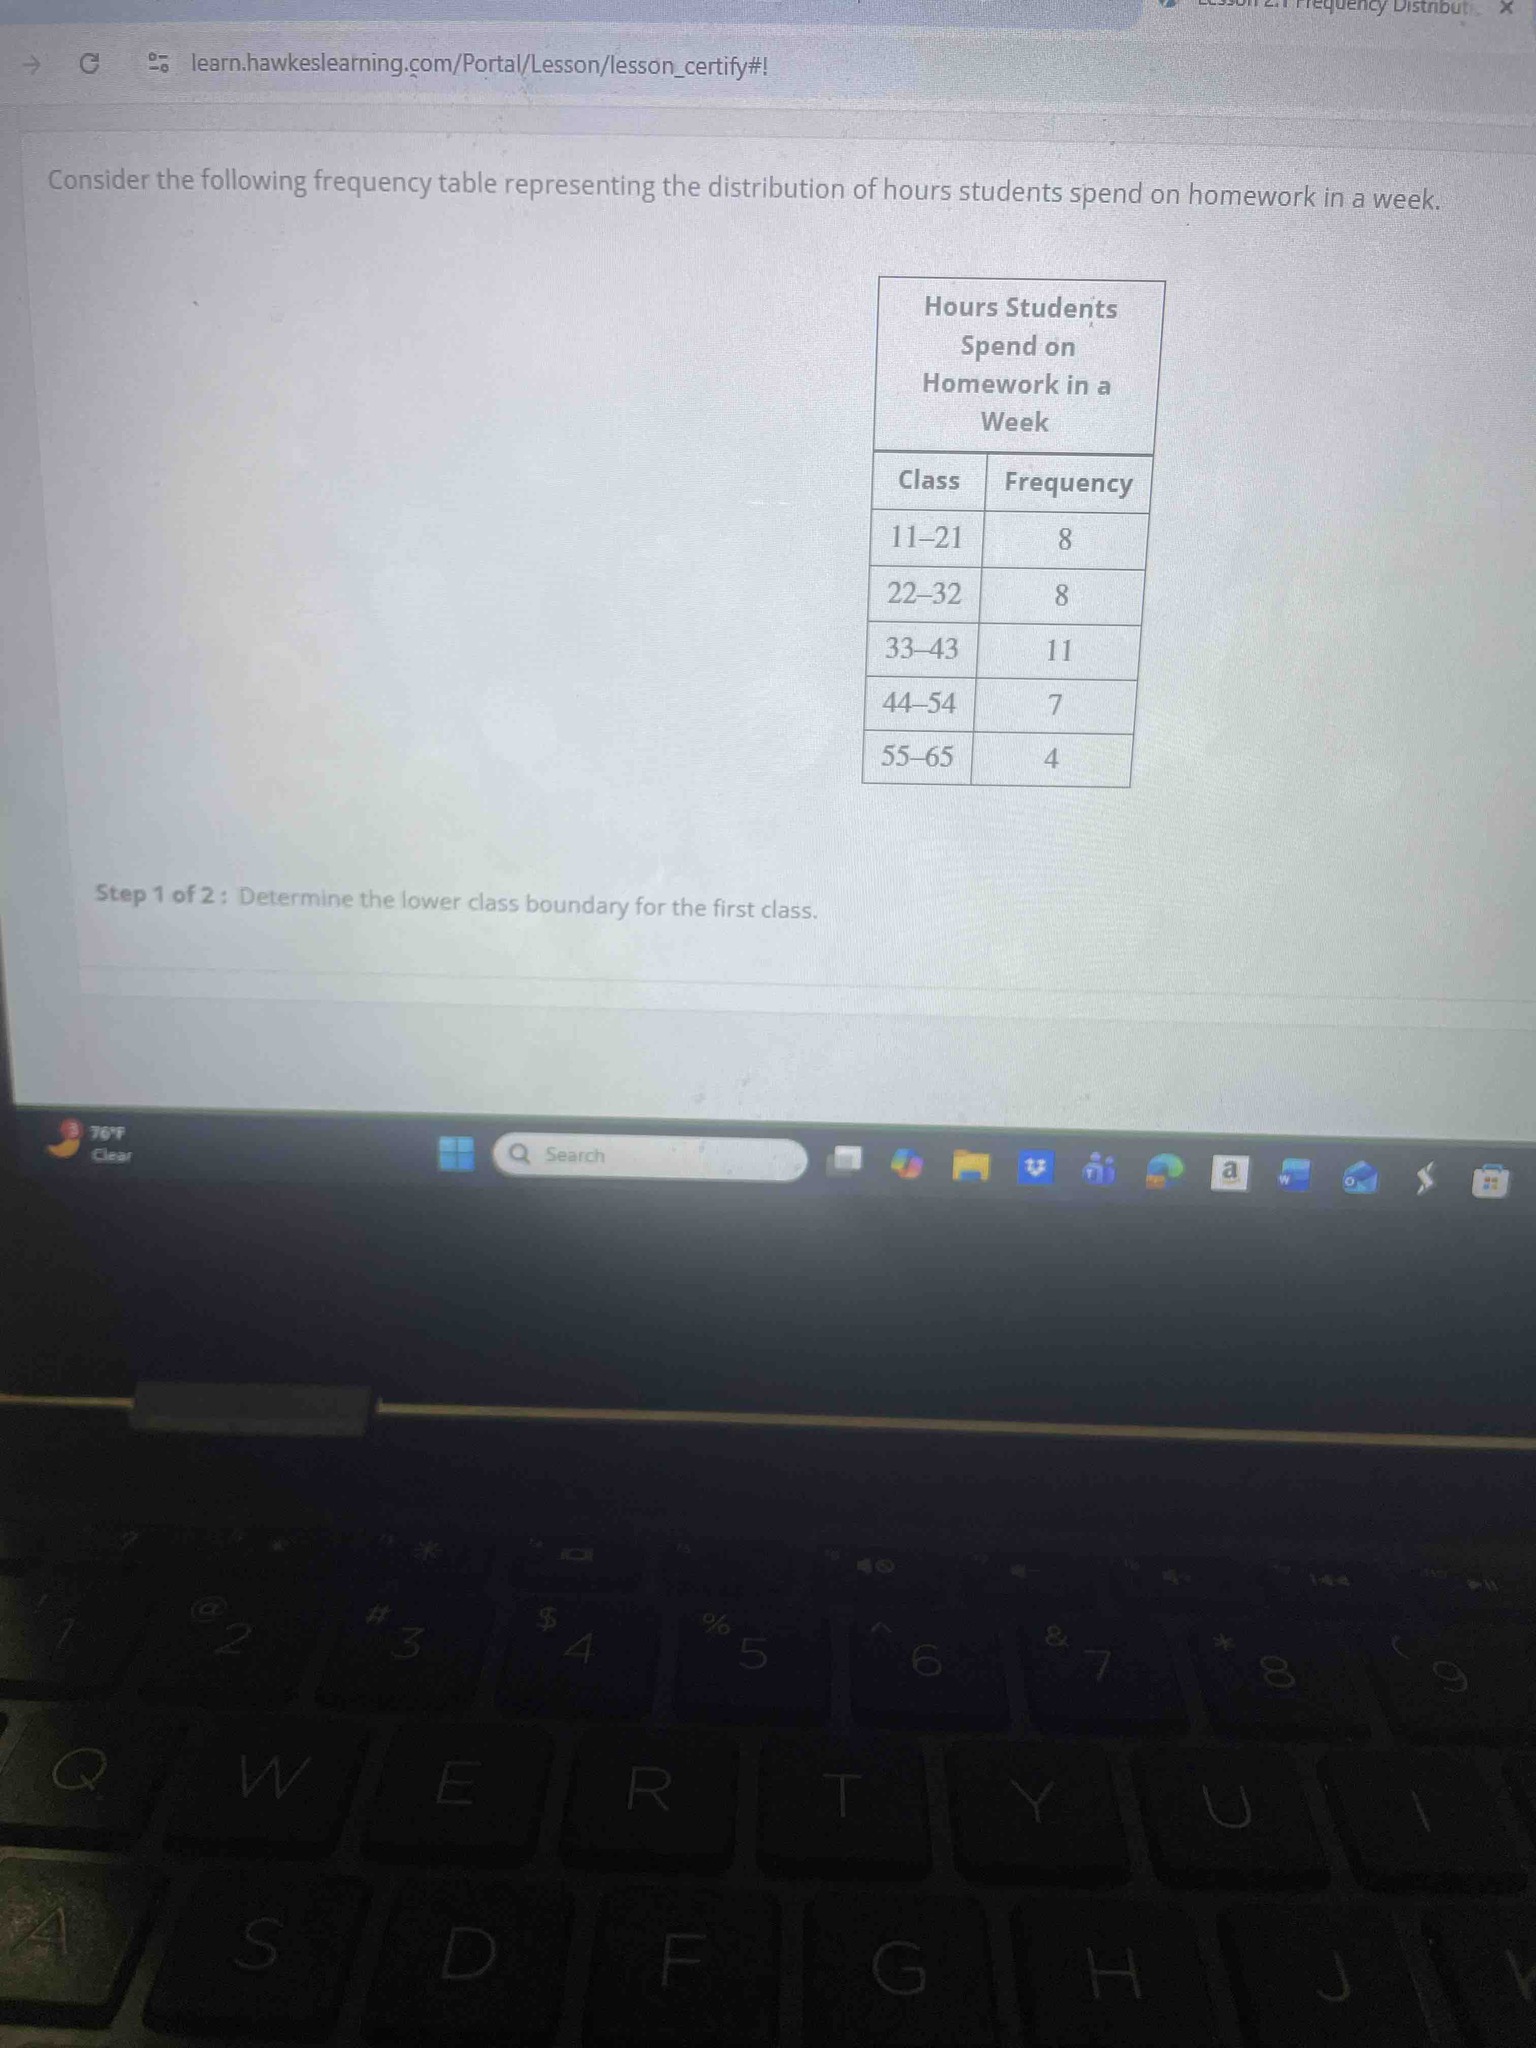
Consider the following frequency table representing the distribution of hours students spend on homework in a week. Determine the lower class boundary for the first class.
Answer
To determine the lower class boundary for the first class, we first identify the first class, which is 11-21. In a frequency distribution with discrete class limits, class boundaries are the midpoints between the upper limit of one class and the lower limit of the next class. To find the boundary, you typically subtract 0.5 from the lower limit or add 0.5 to the upper limit (assuming the data is measured in whole numbers). For the first class (11-21), we look at the gap between its lower limit (11) and what would be the upper limit of a preceding theoretical class. Since the gap between classes is 1 (e.g., between 21 and 22), the boundary is found by subtracting half of that gap (0.5) from the lower limit of the class. Lower class boundary = Lower class limit - 0.5 = 11 - 0.5 = 10.5. Therefore, the lower class boundary for the first class is 10.5.