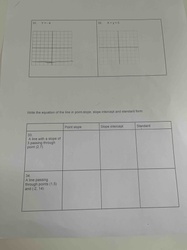
31. Y = -4 32. X + y = 5 Write the equation of the line in point-slope, slope intercept and standard form: 33. A line wi...
A teacher's aide was given 5 1/2 pounds of molding clay and asked to separate it into equal amounts for 3 classrooms. Ho...
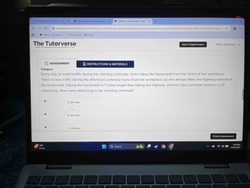
Every day, to avoid traffic during her morning commute, Yunru takes the backroads from her home to her workplace. There ...
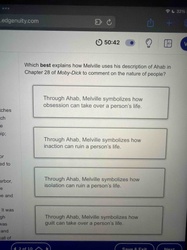
Which best explains how Melville uses his description of Ahab in Chapter 28 of Moby-Dick to comment on the nature of peo...
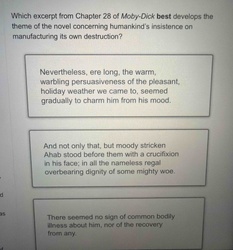
Which excerpt from Chapter 28 of Moby-Dick best develops the theme of the novel concerning humankind's insistence on man...
According to this article, honeybees are used as research subjects in studies of crop rotation. old age. African origins...
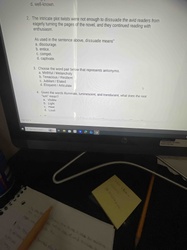
2. The intricate plot twists were not enough to dissuade the avid readers from eagerly turning the pages of the novel, a...
Identify the website URLs and themes listed in the 'SOURCES' slide shown in the image.
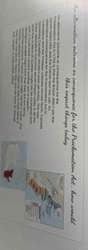
An alternative outcome or consequence for the Proclamation Act, how would this impact things today?
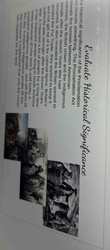
Evaluate Historical Significance: evaluate the historical significance of the Royal Proclamation of 1763 based on the pr...
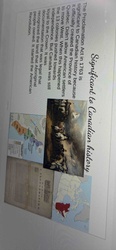
Summarize why the Royal Proclamation of 1763 is significant to Canadian history based on the provided text.
What's a word that starts with "UN," ends with "ABLE," has exactly 10 letters, and can I answer in a short complete sent...
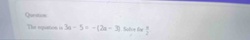
The equation is 3a - 5 = -(2a - 3). Solve for a/2.
Questions for Reflection: 1. What are the core characteristics of a Strategic Family, and how can you nurture these qual...
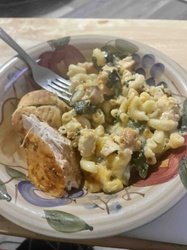
Identify the meal shown in the photograph and describe its main components.

Questions for Reflection: 1. What are the core characteristics of a Strategic Family, and how can you nurture these qual...
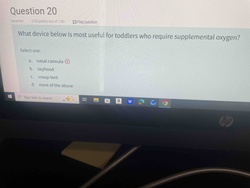
What device below is most useful for toddlers who require supplemental oxygen? Select one: a. nasal cannula b. oxyhood c...
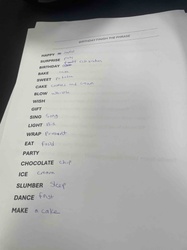
BIRTHDAY FINISH THE PHRASE: Complete the following list of words typically associated with a birthday celebration: HAPPY...
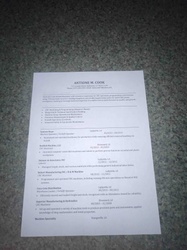
What is the professional experience of Antione M. Cook as shown in his resume?
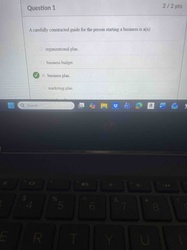
A carefully constructed guide for the person starting a business is a(n) Options: - organizational plan. - business bu...
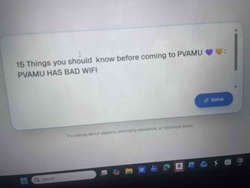
15 Things you should know before coming to PVAMU: PVAMU HAS BAD WIFI
15 Things you should know before coming to PVAMU: bring your car or a scooter
15 Things you should know before coming to PVAMU pick a reasonable meal plan
15 Things you should know before coming to PVAMU. stay at the UC
FRESHMAN ADVICE CLARK ATLANTA University YOU NEED TO BE AWARE OF THESE THINGS: The Dating Scene Love IN THE AUC
FRESHMAN ADVICE CLARK ATLANTA University YOU NEED TO BE AWARE OF THESE THINGS: Important things what you need to know?
FRESHMAN ADVICE CLARK ATLANTA UNIVERSITY YOU NEED TO BE AWARE OF THESE THINGS: Academic Supplies what you need?
FRESHMAN ADVICE : CLARK ATLANTA university dorm essential what to bring. LETTER A GRADE AT THE END
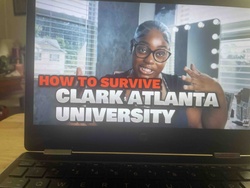
How to survive Clark Atlanta University?
What is the identity of the university mentioned on the woman's red sweatshirt in the image?
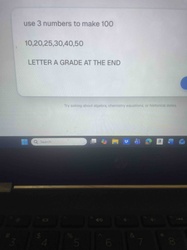
Use 3 numbers from the set {10, 20, 25, 30, 40, 50} to make 100.

WHAT IS CHAOS?

What is a sign of low intelligence?
Answer without Google: What's the largest organ in the human body?
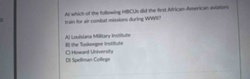
At which of the following HBCUs did the first African-American aviators train for air combat missions during WWII? A) L...
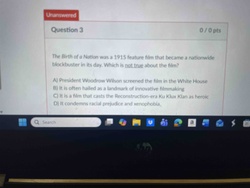
The Birth of a Nation was a 1915 feature film that became a nationwide blockbuster in its day. Which is not true about t...
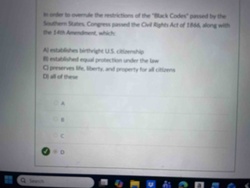
In order to overrule the restrictions of the "Black Codes" passed by the Southern States, Congress passed the Civil Righ...
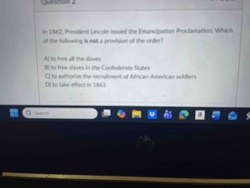
In 1862, President Lincoln issued the Emancipation Proclamation. Which of the following is not a provision of the order?...
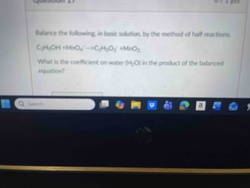
Balance the following, in basic solution, by the method of half reactions. C2H5OH + MnO4- -> C2H3O2- + MnO2. What is the...
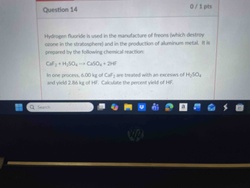
Hydrogen fluoride is used in the manufacture of freons (which destroy ozone in the stratosphere) and in the production o...
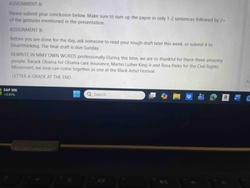
REWRITE IN MMY OWN WORDS professionally During this time, we are so thankful for these three amazing people. Barack Obam...
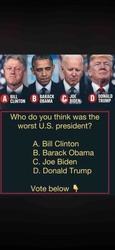
Who do you think was the worst U.S. president? A. Bill Clinton B. Barack Obama C. Joe Biden D. Donald Trump