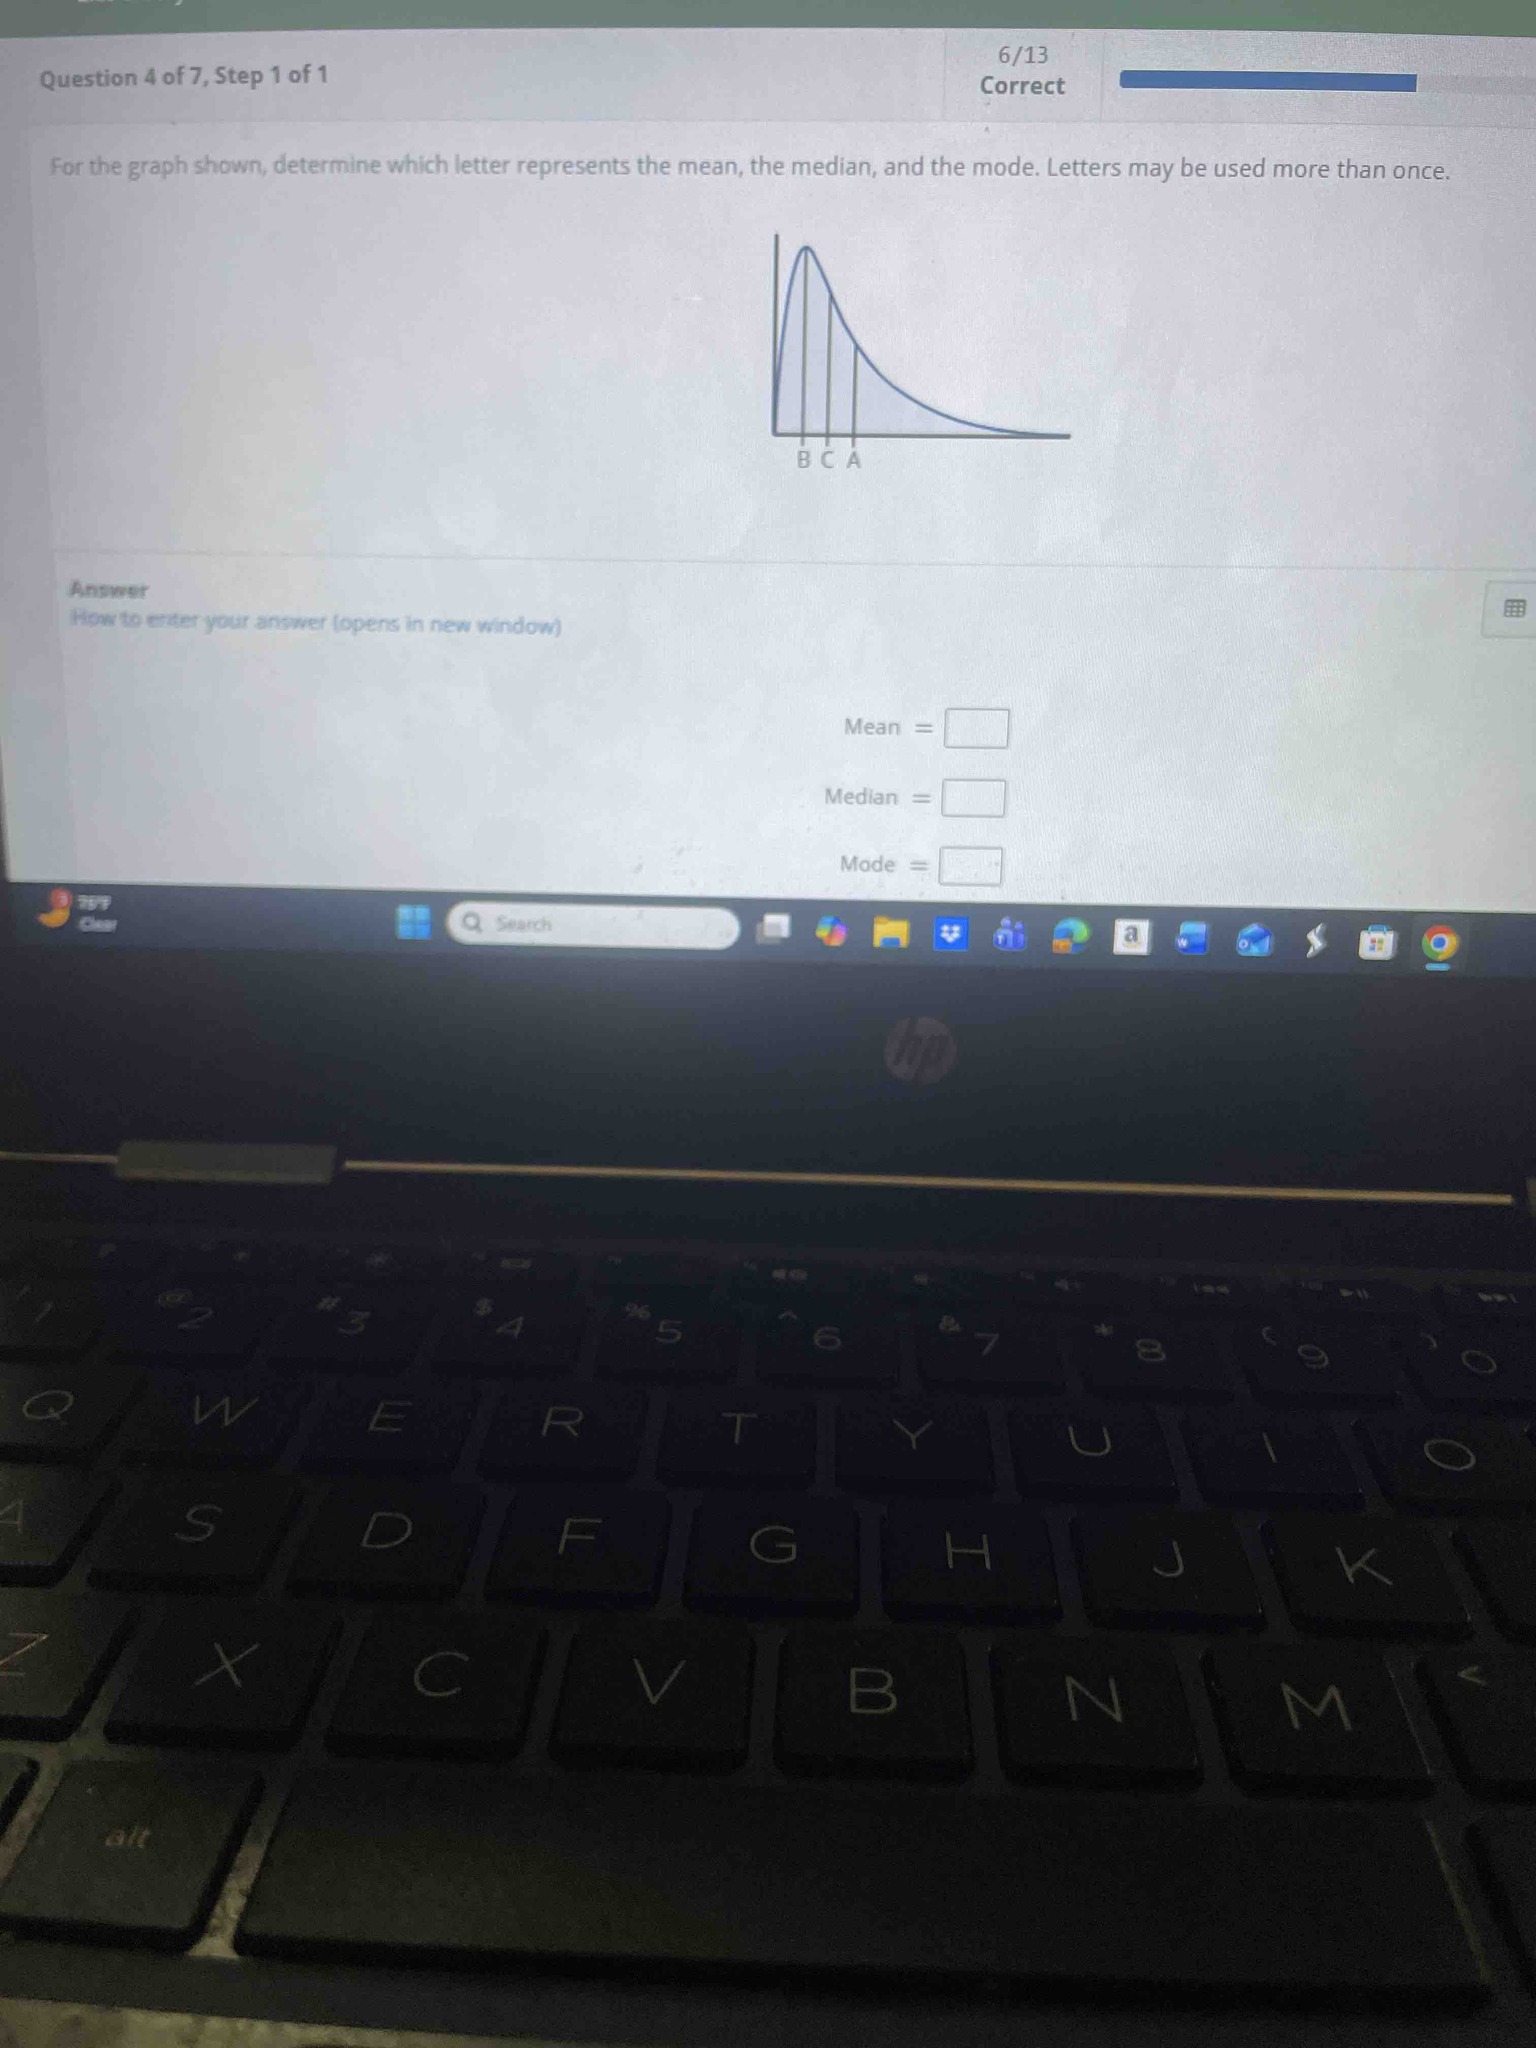
For the graph shown, determine which letter represents the mean, the median, and the mode. Letters may be used more than once.
Answer
The provided graph shows a positively skewed (right-skewed) distribution. In such a distribution, the measures of central tendency follow a specific order based on their location on the x-axis: 1. Mode: The mode is the value that occurs most frequently, which corresponds to the highest point (peak) on the graph. In this graph, line B is directly under the peak, so Mode = B. 2. Median: The median is the middle value of the data set, dividing the area under the curve into two equal parts. In a right-skewed distribution, the median is always to the right of the mode because the long tail pulls the center of the area in that direction. Therefore, Median = C. 3. Mean: The mean is the arithmetic average and is most heavily influenced by extreme values (outliers) in the tail of the distribution. In a right-skewed distribution, the mean is pulled furthest toward the tail. Therefore, Mean = A. Final Answer: Mean = A, Median = C, Mode = B.