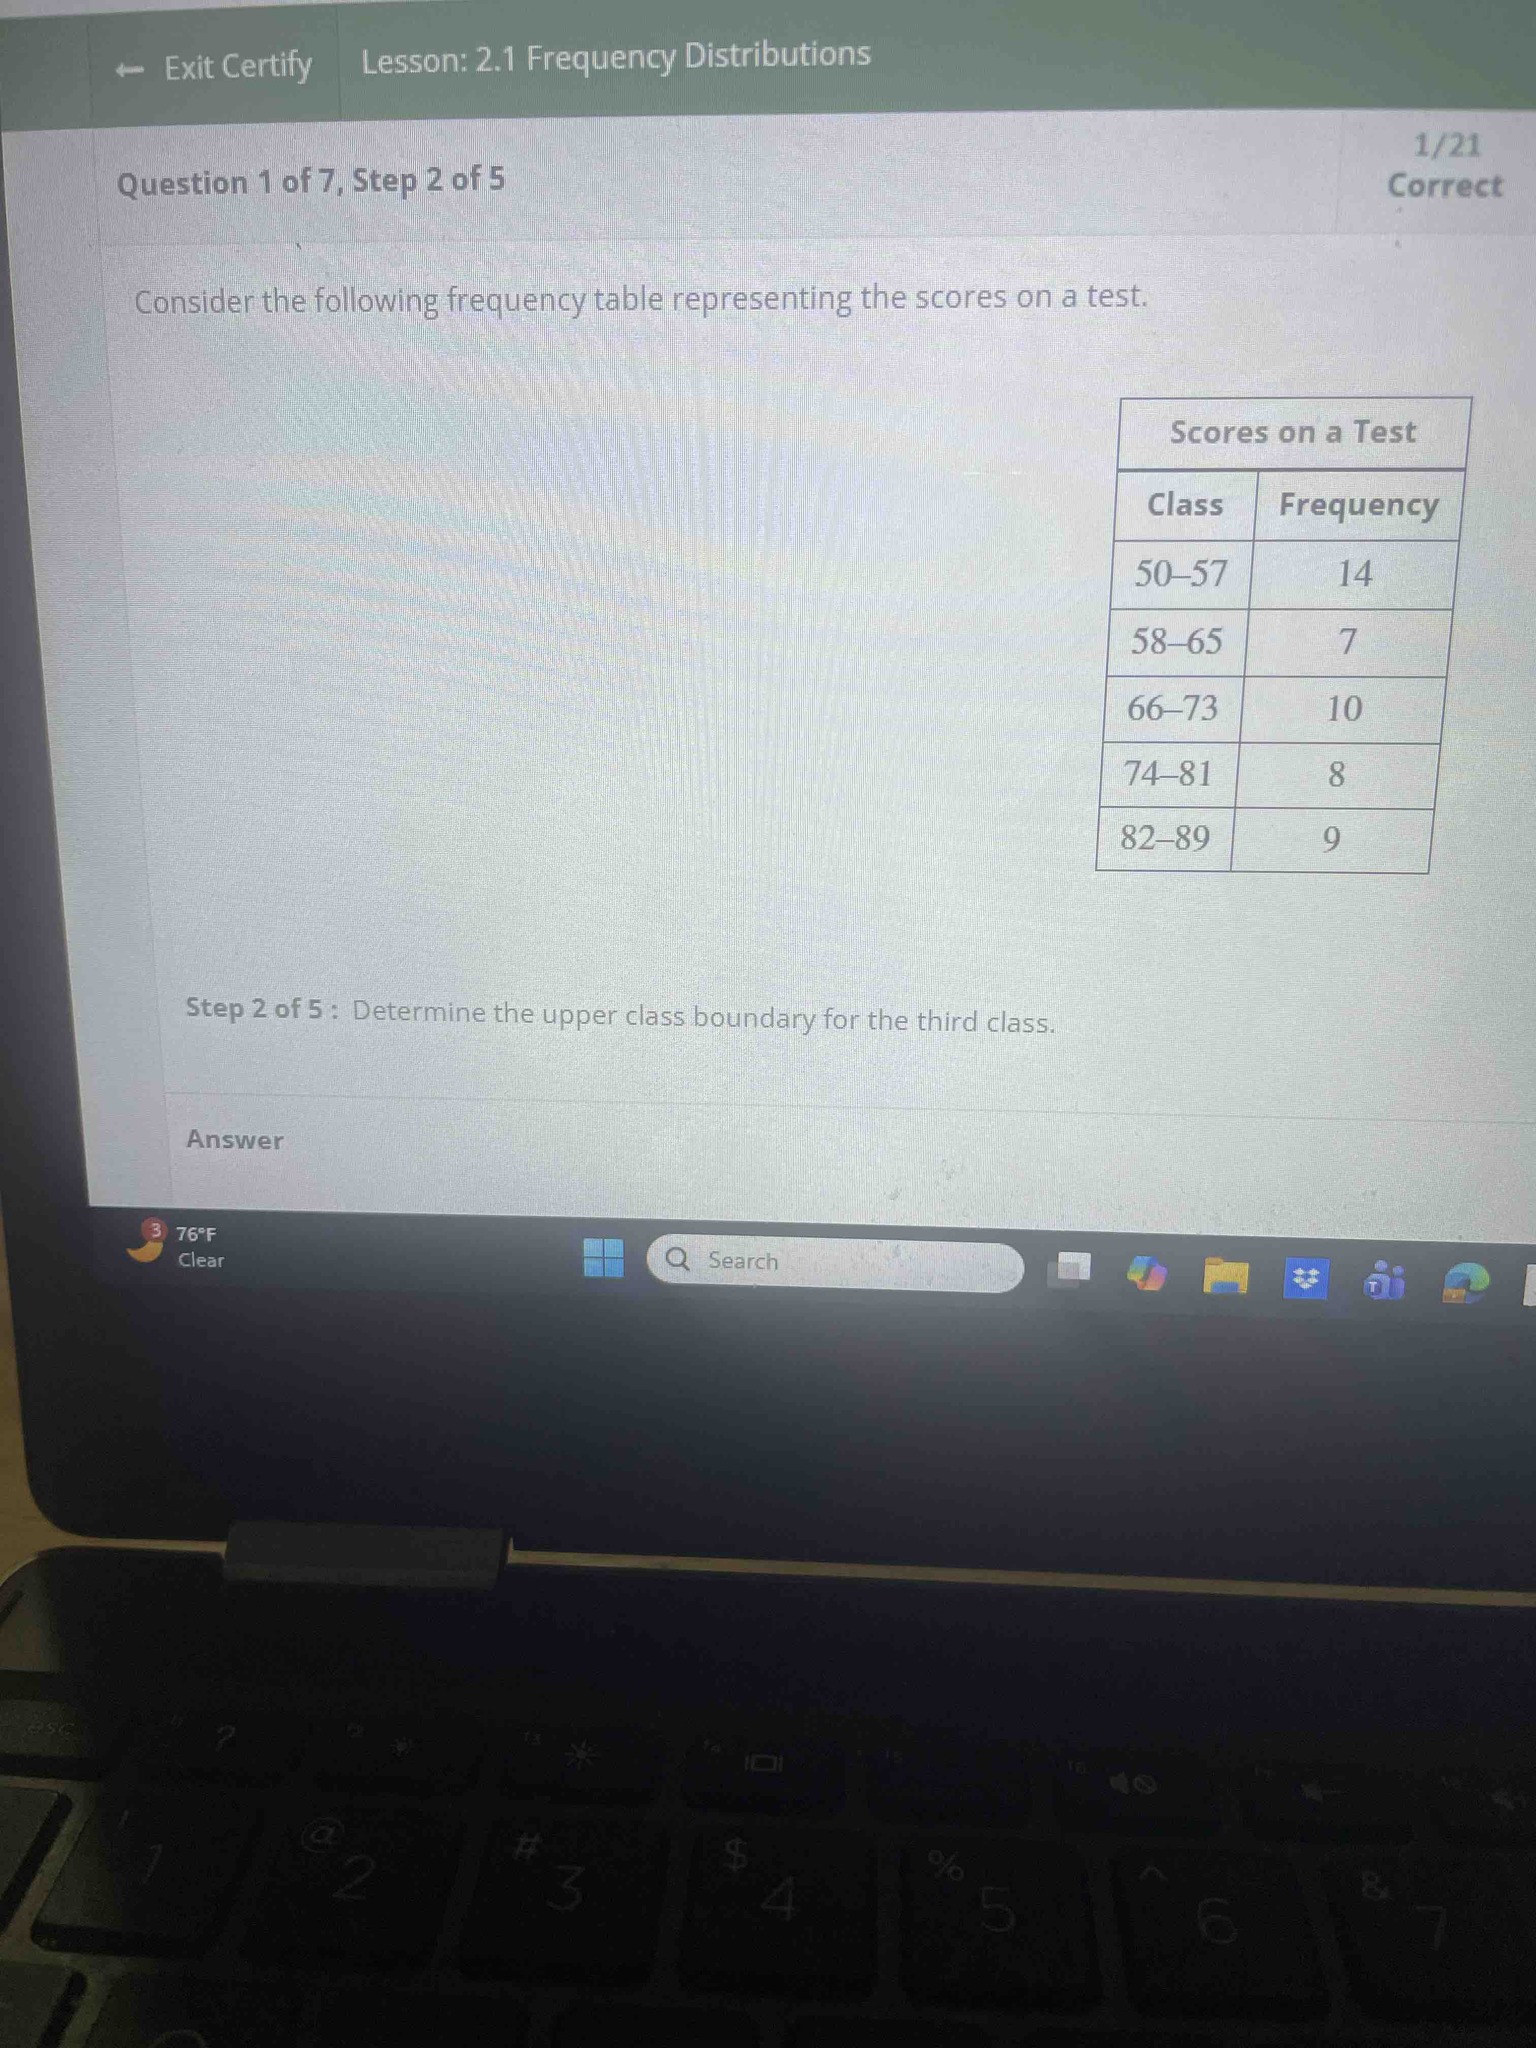
Consider the following frequency table representing the scores on a test. Class intervals and frequencies are given: 50–57 (14), 58–65 (7), 66–73 (10), 74–81 (8), 82–89 (9). Determine the upper class boundary for the third class.
Answer
To find the upper class boundary for a given class in a frequency distribution where the data are whole numbers, you look at the upper limit of that class and the lower limit of the next class. The class boundary is the midpoint between these two values. 1. Identify the third class: The third class is 66–73. 2. Identify the upper limit of the third class: The upper limit is 73. 3. Identify the lower limit of the fourth class: The next class starts at 74. 4. Calculate the midpoint: To find the boundary between 73 and 74, add them together and divide by 2: (73 + 74) / 2 = 147 / 2 = 73.5. Therefore, the upper class boundary for the third class is 73.5.