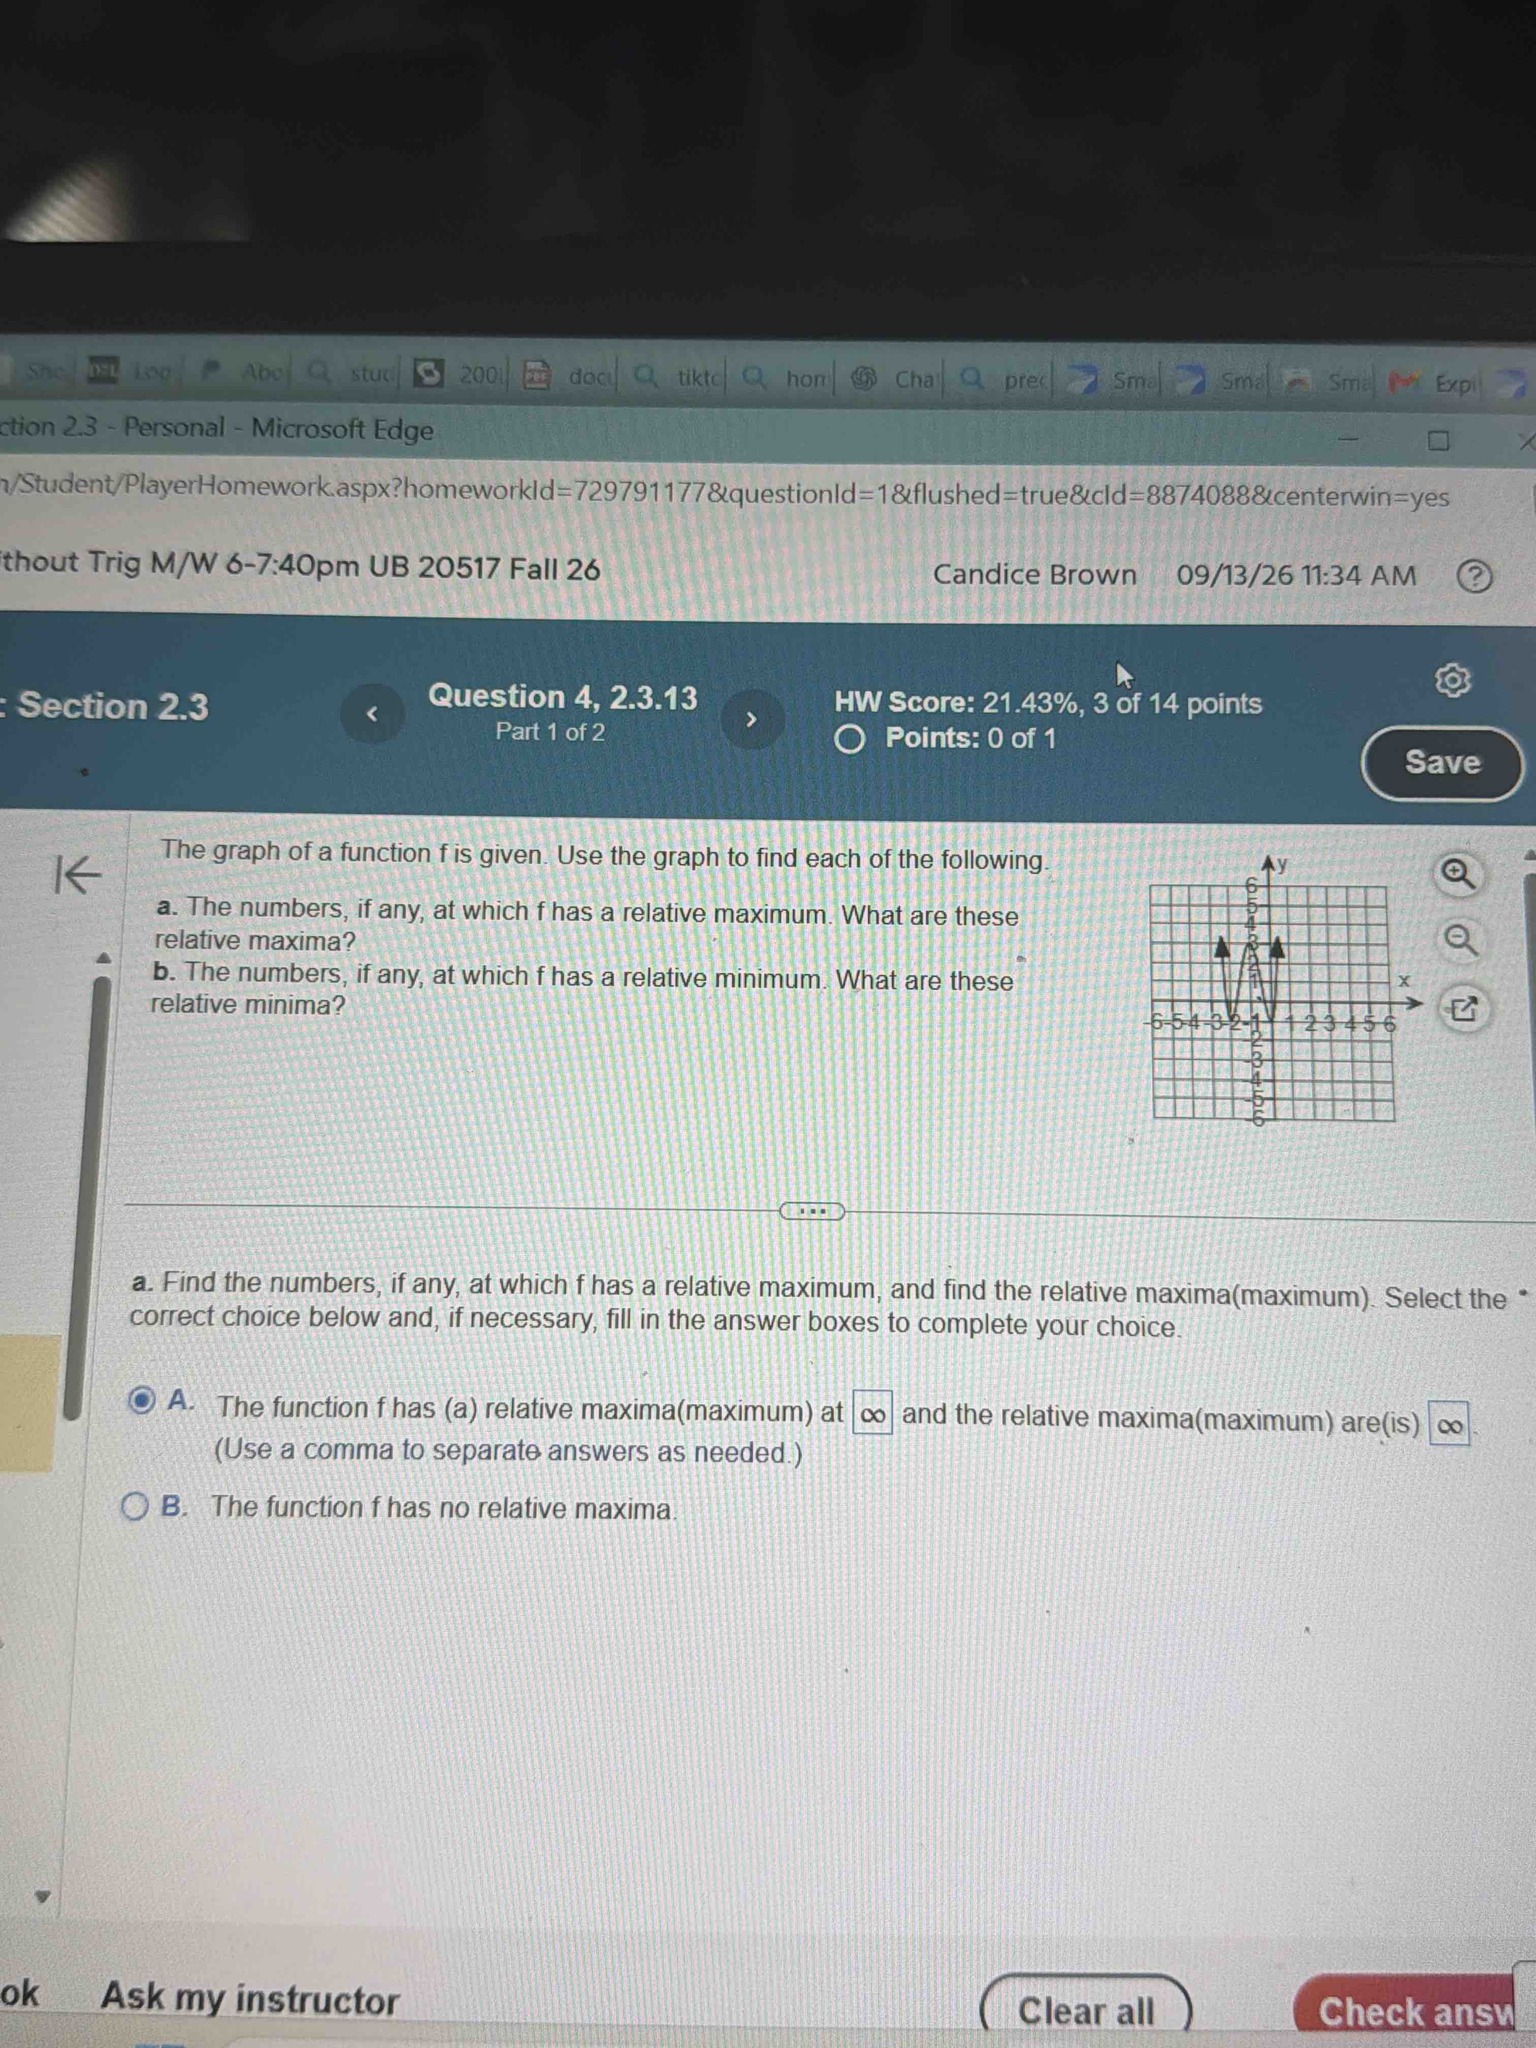
The graph of a function f is given. Use the graph to find each of the following. a. The numbers, if any, at which f has a relative maximum. What are these relative maxima? b. The numbers, if any, at which f has a relative minimum. What are these relative minima?
Answer
To find the relative maxima and relative minima from the given graph of function f, we look at the peaks and valleys of the curve. Looking at the graph, there are two peaks (relative maxima) and one valley (relative minimum). Part a: The function has relative maxima at x = -2 and x = 2. At x = -2, the value of the function is 4. At x = 2, the value of the function is 4. Thus, the relative maxima are 4 at x = -2 and x = 2. Part b: The function has a relative minimum at x = 0. At x = 0, the value of the function is 0. Thus, the relative minimum is 0 at x = 0.