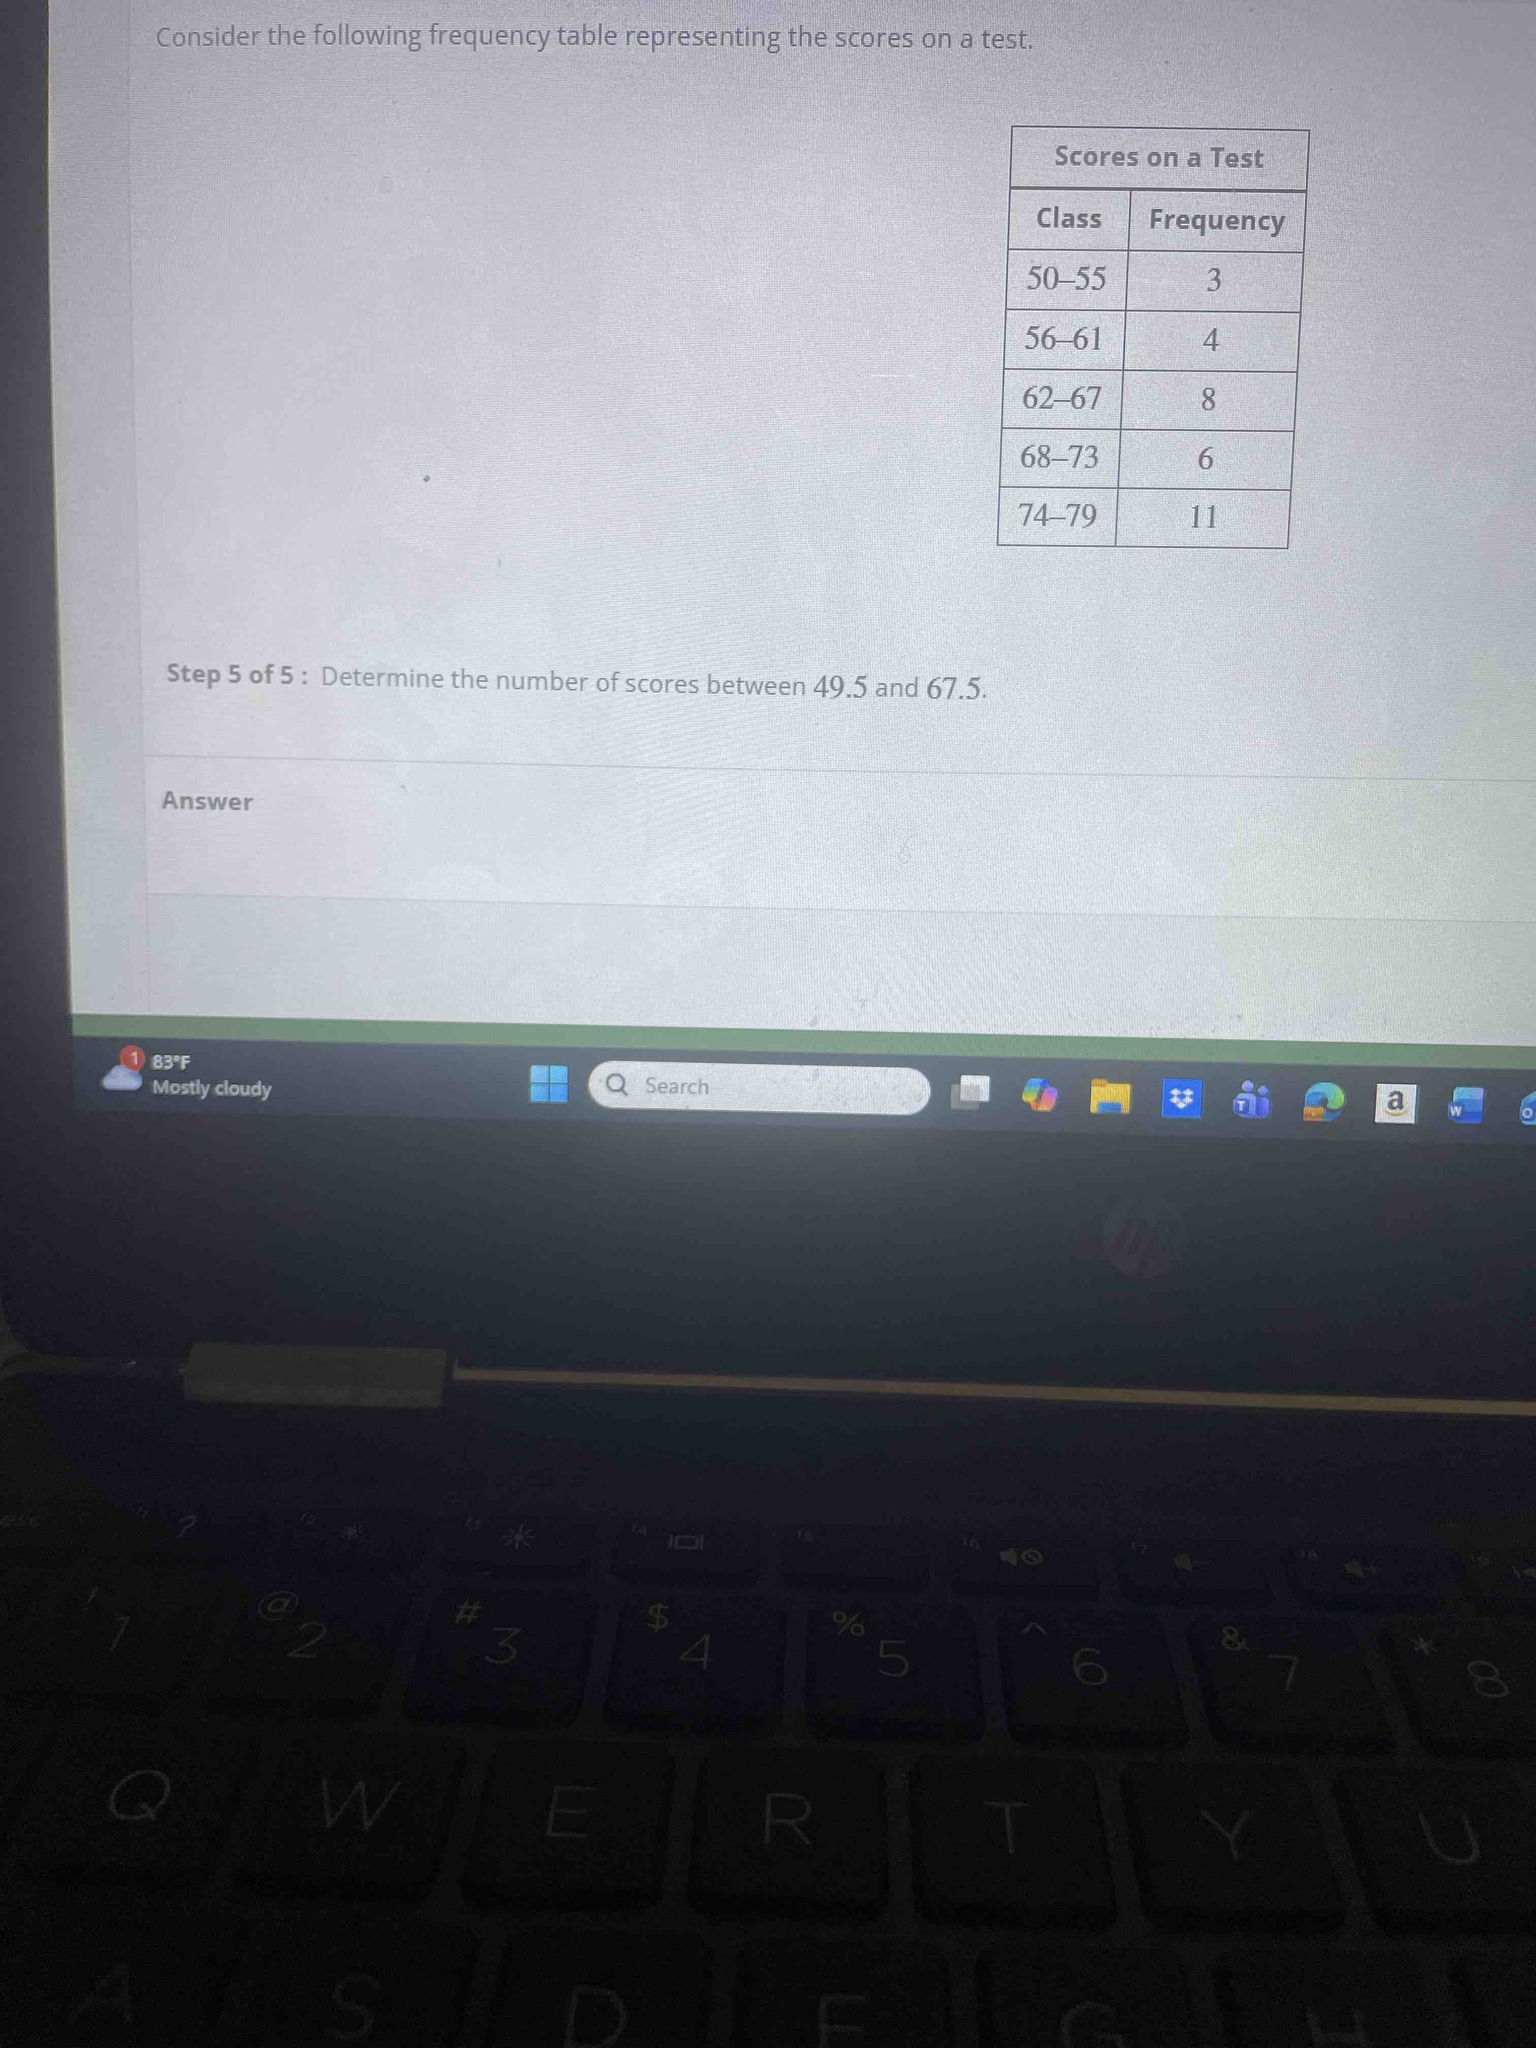
Consider the following frequency table representing the scores on a test. Class: 50-55, Frequency: 3; Class: 56-61, Frequency: 4; Class: 62-67, Frequency: 8; Class: 68-73, Frequency: 6; Class: 74-79, Frequency: 11. Determine the number of scores between 49.5 and 67.5.
Answer
To find the number of scores between 49.5 and 67.5, we must look at the class boundaries of the given frequency table. These boundaries represent the theoretical limits of each class interval where 0.5 is subtracted from the lower limit and added to the upper limit of each class. 1. The first class is 50-55. Its boundaries are 49.5 and 55.5. The frequency for this interval is 3. 2. The second class is 56-61. Its boundaries are 55.5 and 61.5. The frequency for this interval is 4. 3. The third class is 62-67. Its boundaries are 61.5 and 67.5. The frequency for this interval is 8. The range from 49.5 to 67.5 perfectly encompasses these first three class intervals. Therefore, to find the total number of scores in this range, we sum the frequencies of these three classes: Total = 3 (from class 50-55) + 4 (from class 56-61) + 8 (from class 62-67) = 15. There are 15 scores between 49.5 and 67.5.