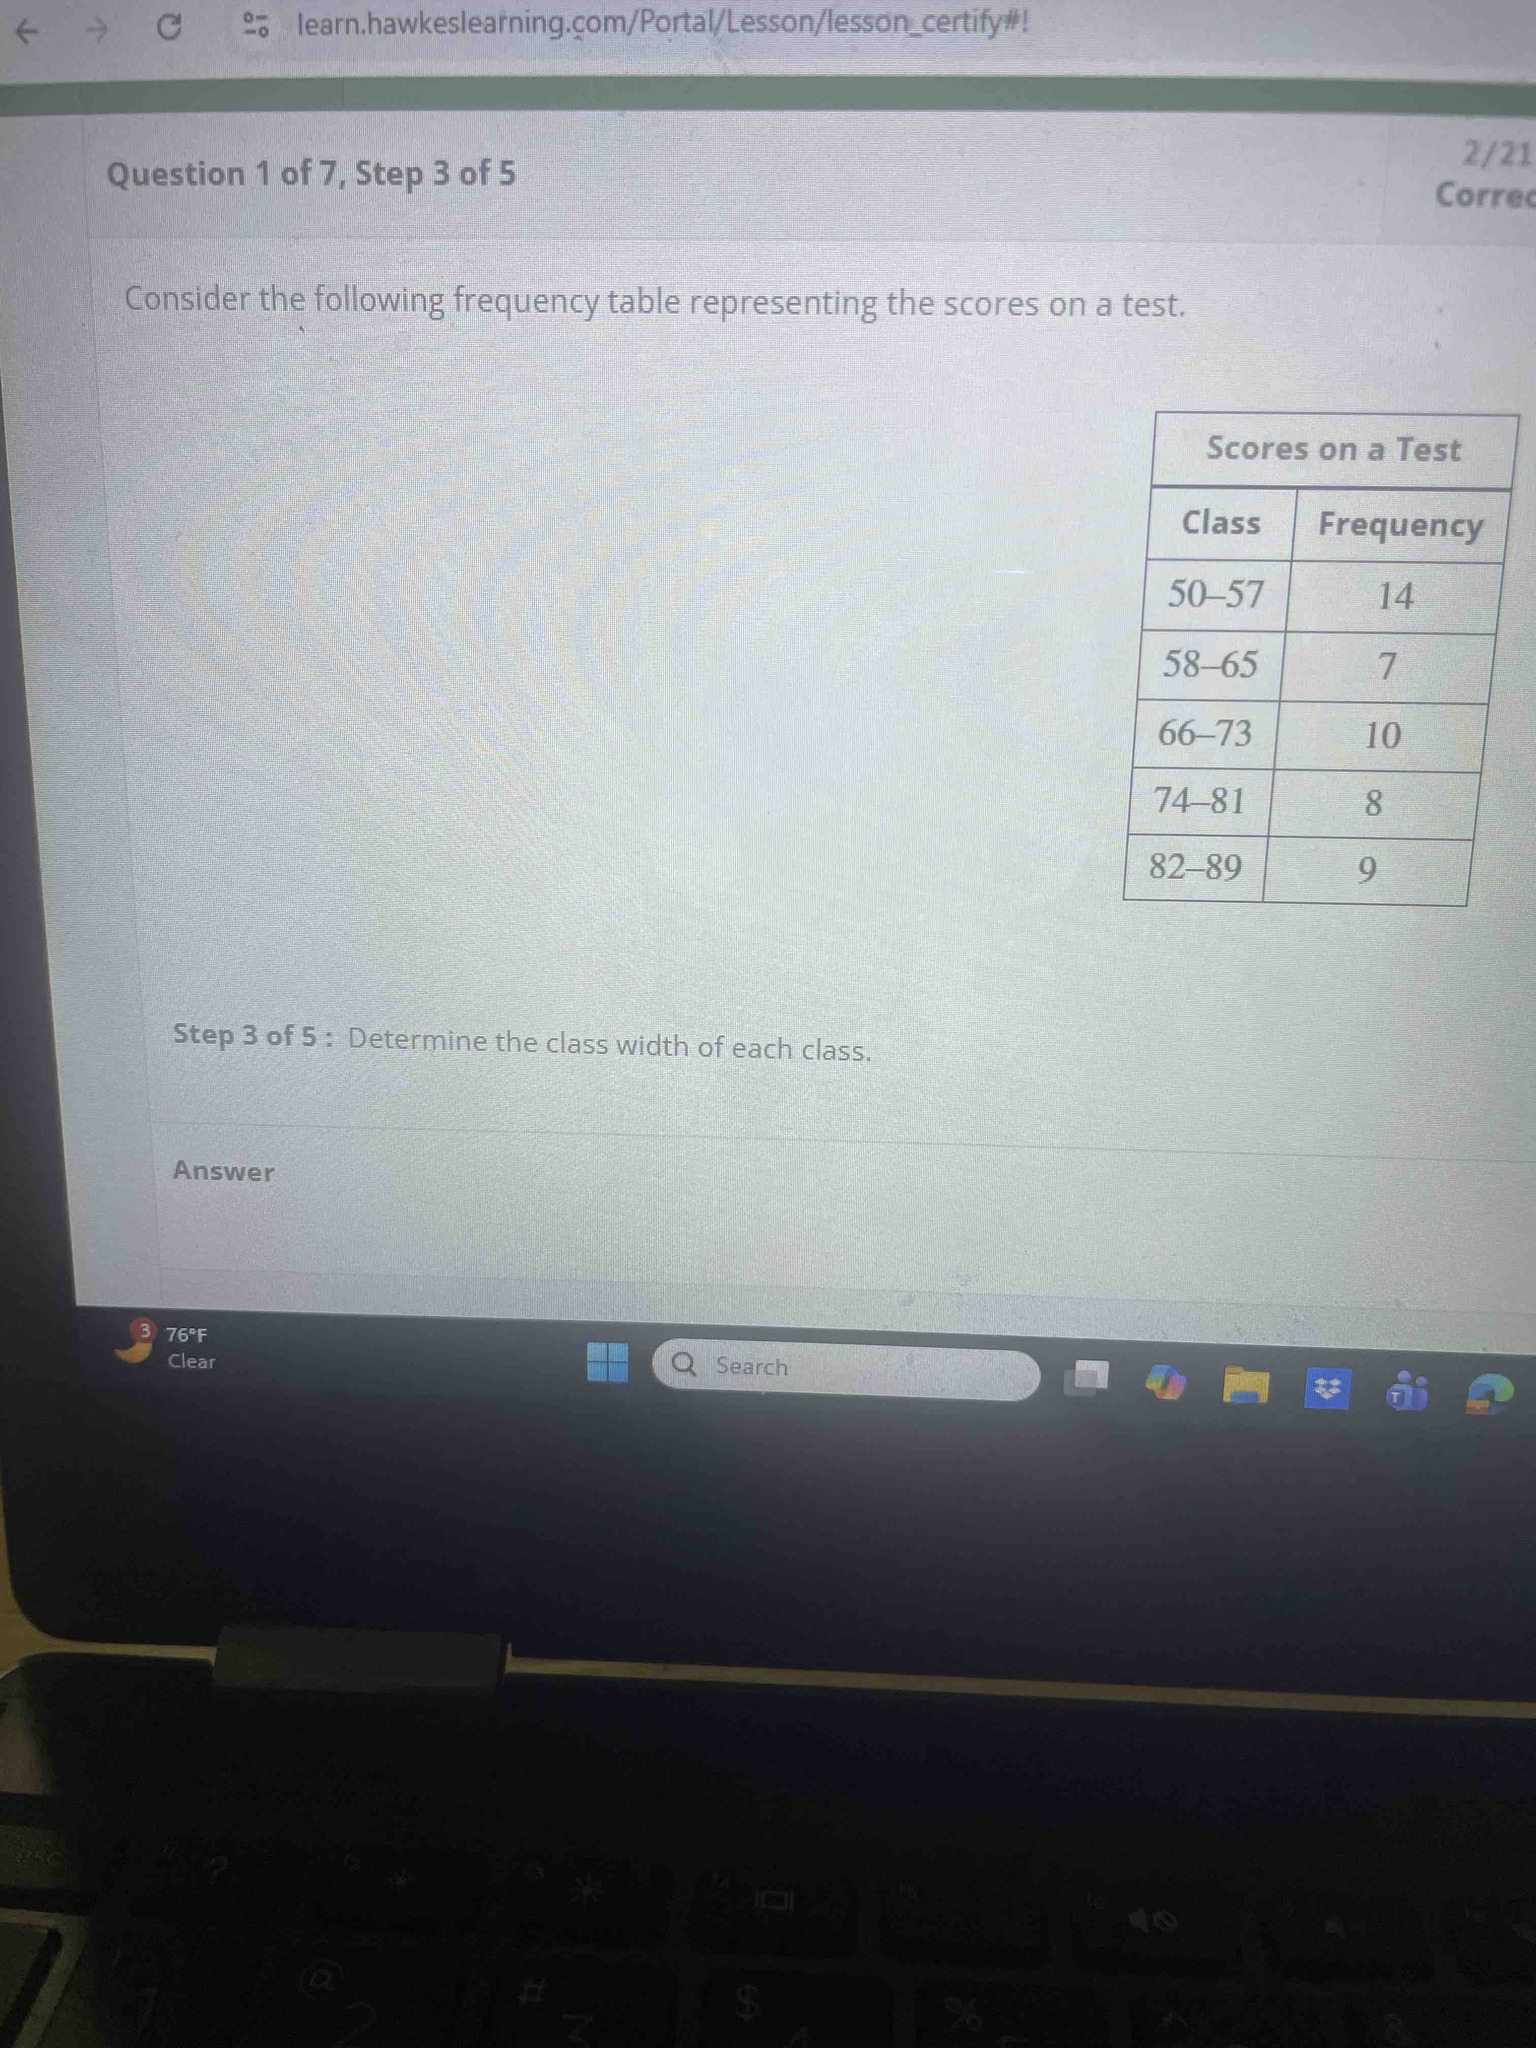
Consider the following frequency table representing the scores on a test. Step 3 of 5: Determine the class width of each class. Table data: Class 50-57, Frequency 14; Class 58-65, Frequency 7; Class 66-73, Frequency 10; Class 74-81, Frequency 8; Class 82-89, Frequency 9.
Answer
To determine the class width of a frequency distribution table, you subtract the lower limit of one class from the lower limit of the next successive class. For example, looking at the first two classes: Lower limit of the second class (58) minus Lower limit of the first class (50) equals 8 (58 - 50 = 8). Alternatively, you can use the upper limits: Upper limit of the second class (65) minus Upper limit of the first class (57) equals 8 (65 - 57 = 8). You can verify this for any consecutive pairs in the table: 66 - 58 = 8, 74 - 66 = 8, and 82 - 74 = 8. Therefore, the class width of each class is 8.