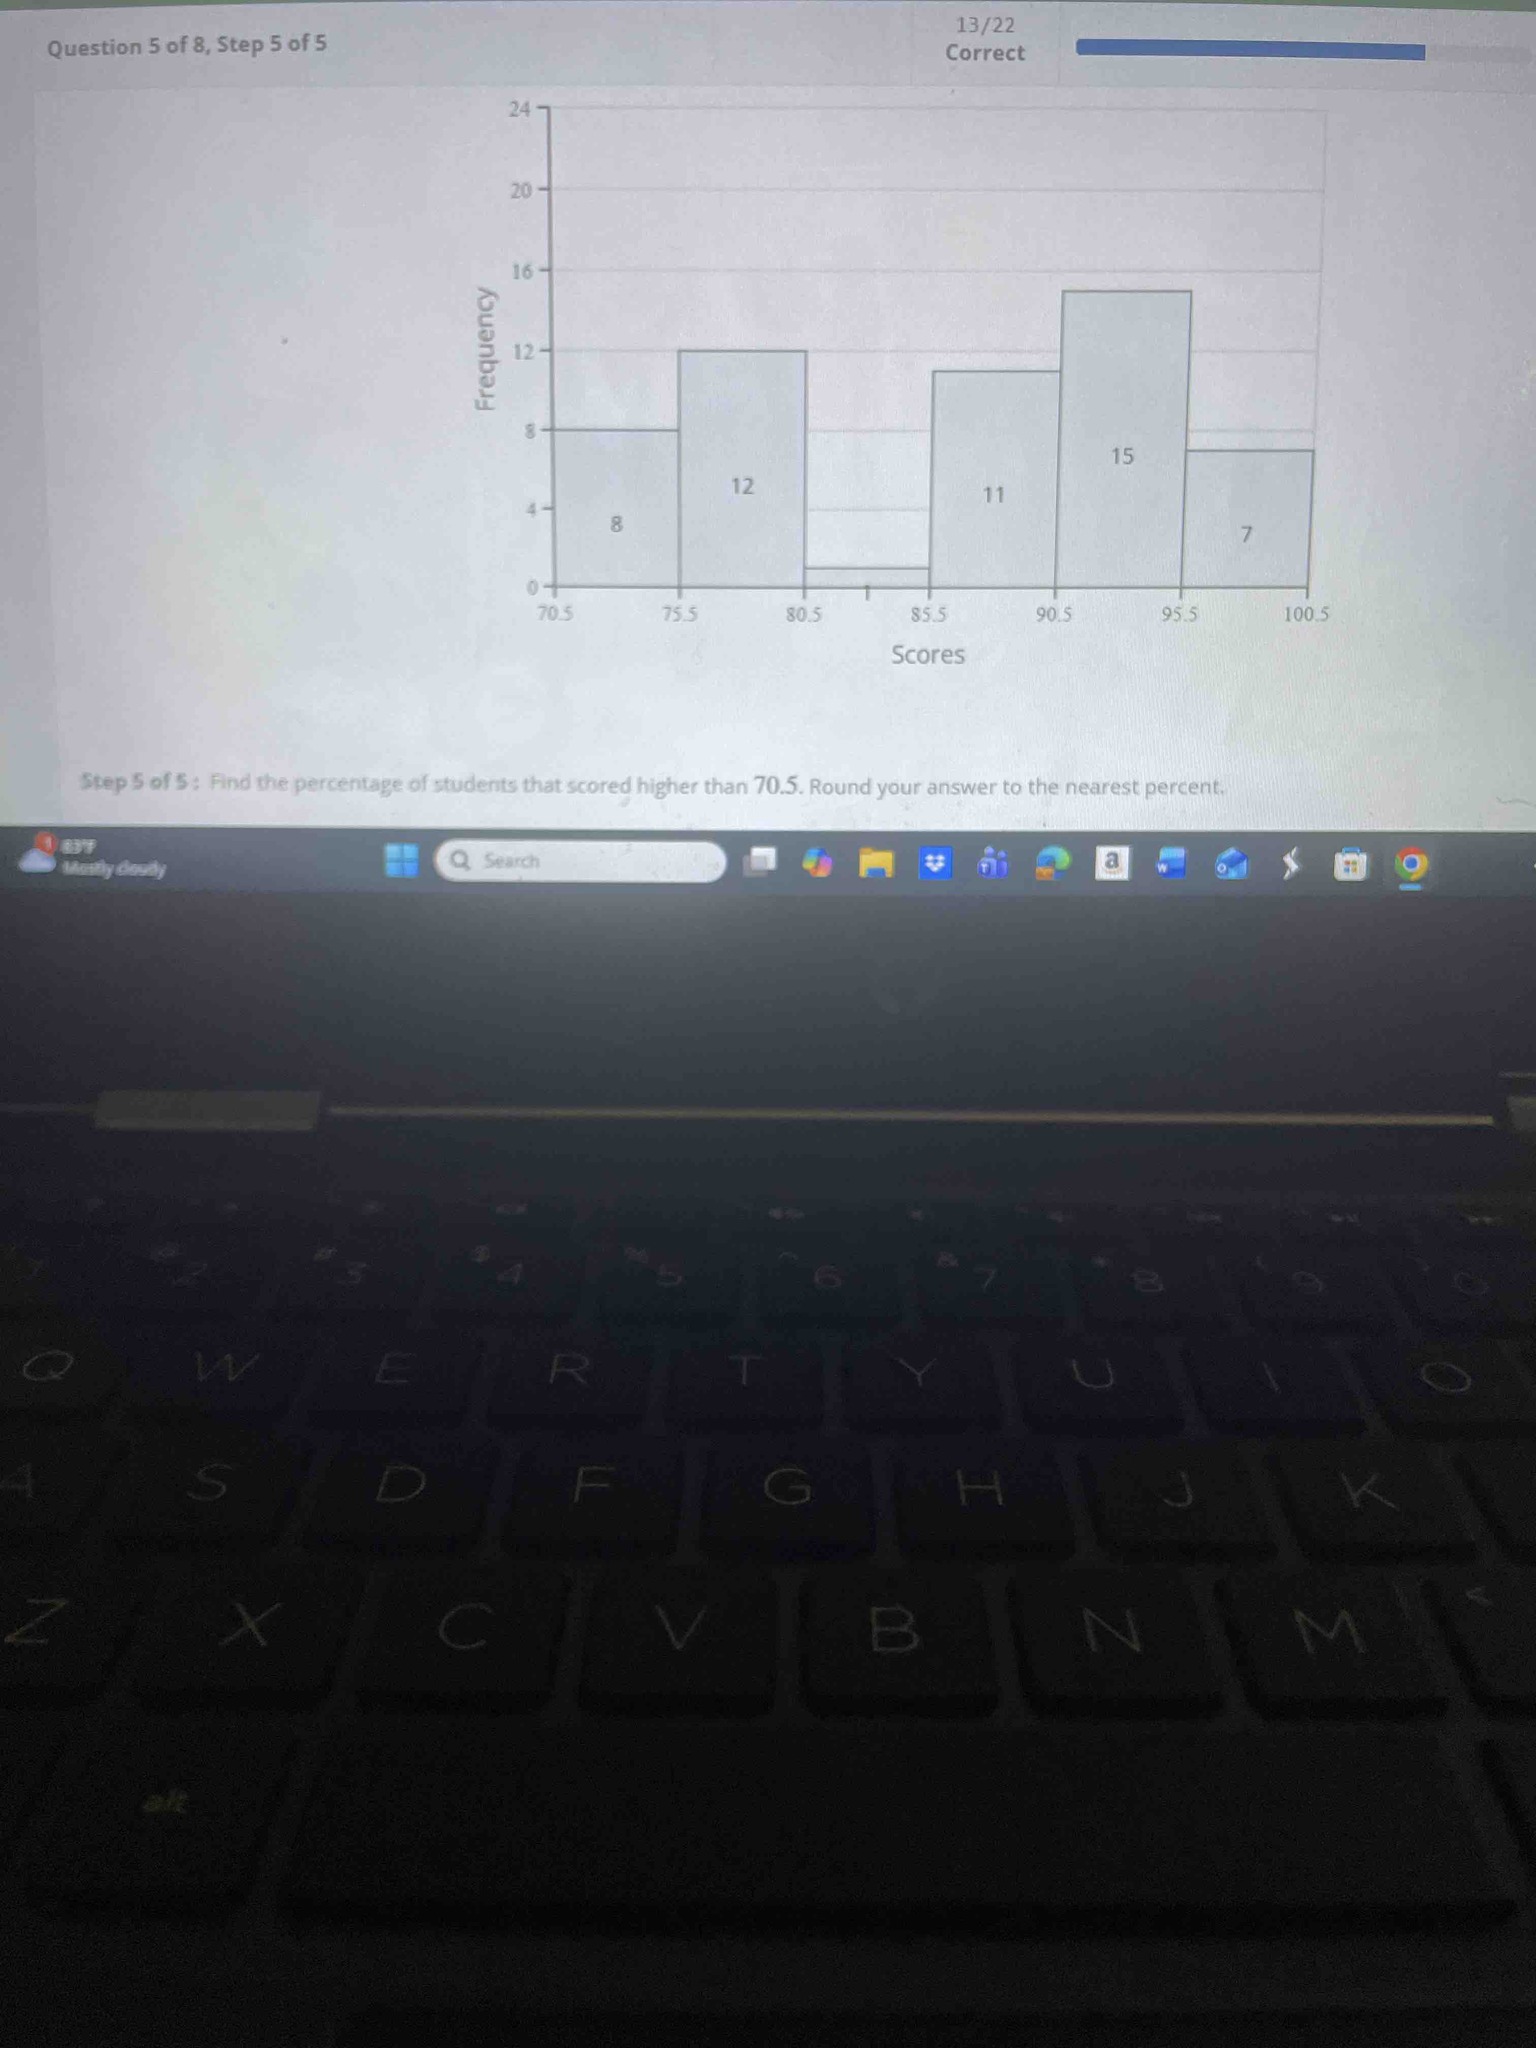
Find the percentage of students that scored higher than 70.5. Round your answer to the nearest percent.
Answer
To find the percentage of students who scored higher than 70.5, we first need to determine the total number of students represented in the histogram and then how many of them scored above 70.5. 1. Identify the frequency of each bar in the histogram: The bars represent scores in different ranges. Starting from the left, the frequencies are 8 (70.5-75.5), 12 (75.5-80.5), 1 (80.5-85.5, based on the visual height), 11 (85.5-90.5), 15 (90.5-95.5), and 7 (95.5-100.5). 2. Calculate the total number of students: Total = 8 + 12 + 1 + 11 + 15 + 7 = 54. 3. Calculate the number of students who scored higher than 70.5: Looking at the x-axis, all the data points represented in the bars start at 70.5. Therefore, every single student in this dataset scored at least 70.5 or higher. The count is 54. 4. Calculate the percentage: Percentage = (Number of students scoring higher than 70.5 / Total number of students) * 100. Percentage = (54 / 54) * 100 = 1 * 100 = 100%. Rounded to the nearest percent, the answer is 100%.